A new session of the “Maritime Data Processing” programme was delivered in Mombasa (Kenya) from 25 March to 6 April 2018.
Following the first level session, this session (MDP4 level 2) deepened the skills in maritime data visualisation. Participants learned how to clean and select shipping data; both by using Excel functions and SQL language. They also learned how to use QGIS, a free and open-source desktop geographic information system (GIS) application that provides data viewing and editing.
The three tools are complementary:
⇒ SQL enables extracting and processing desired data from databases containing millions of shipping records. The participants learn how to write SQL queries; for example, query to obtain the unique identification of ships located within the oil-spill region on 2nd of April.
⇒ Excel is used to perform statistical analysis; for example, computing the frequencies of vessel types present in the oil spill region.
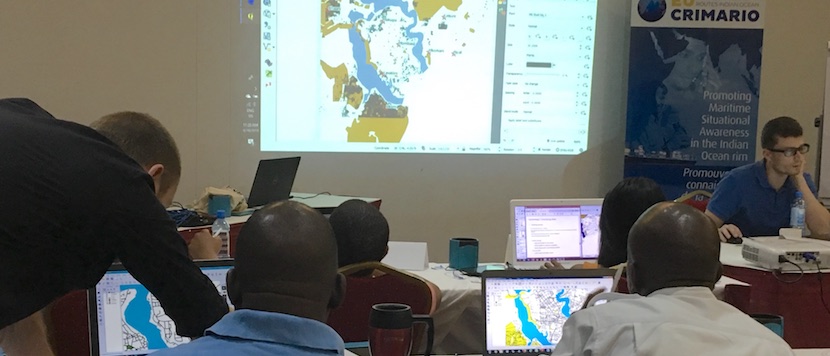
⇒ QGIS enables to project the data on the map for further analysis; for instance, AIS data can be used to display the location of ships navigating through the oil-spill region.
This second session was attended by the 12 participants who successfully completed the test following the first session. The successful one will attend the next train the trainer session organised from 4 to 22 June in Mombasa, to develop training skills in data visualisation.
Kenya attendees belong to the main agencies involved in the surveillance of maritime domain: Fisheries Service, KMA (Kenya Maritime Authority), Navy, Revenue Authority and Ministry of Interior. In addition three participants from Madagascar working at RMIFC (Regional Maritime Information Fusion Centre), Secretary of State at Sea and APMF (Port Authority).