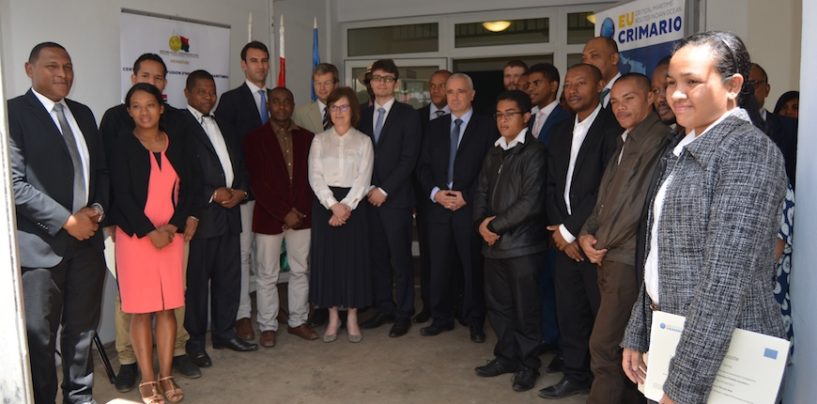
Twelve trainees, 7 Malagasy and 5 Comorians, have finished a 7 week on-site training which was broken down into three training periods during a 6 month period (October 2016 to March 2017). In between the two first sessions, the students followed an additional 1 month distance training program.
Training objective
The objective of the training is to learn all necessary skills to extract (from a file, internet or a database …), clean, format, enrich and present maritime data (on a spreadsheet, a chart, a geographical information system…). See an example of work done during this course.
« Data of maritime interest» are data related to the maritime domain. Some non exhaustif examples: vessel data (identity, positions AIS-GPS-VMS, manifests…), port and customs statistics, marine meteorology, environmental data, shipping routes et maritime zones …
Target Audience
Staff in charge of data preparation and visualisation within maritime operation centres, civil or military administrations in charge of action of state at sea.
Knowledge acquired at the end of the training
The training started with 46 students (23 Comorians and 23 Malagasy). After the first training session, 20 obtained the « Specialist in visualisation of maritime data – Level 1 » certificate.
These students now know :
- The IT formats for data adapted to maritime data, their purpose and limits, and how to choose the most relevant format to resolve a given issue.
- How to choose and install the appropriate free software according to the data processing issue at stake, and use its basic functions.
- How to use GoogleEarth© professionally to visualise maritime data and export the result to another application.
- How to use Microsoft© Excel professionally to filter and format data, create quality charts and export the results.
- How to share data in the most appropriate format.
Further to the second training session, 12 students obtained the « Specialist in visualisation of maritime data – Level 2 » certificate
These students now know how to:
- Use the advanced functions of Microsoft© Excel (assumption tests, pivot tables) to conduct a basic maritime data analysis.
- Choose and install a Geographical Information System adapted to the needs of maritime data processing, use its functions to build high quality maps and charts that can support an important volume of data.
- Install and administer (basic functions) a collaborative knowledge sharing data base (Wiki).
- Use, and to a lesser extent modify, maritime data processing programs in Python language.
- Use, and to a lesser extent modify, basic maritime data requests in MySQL© Oracle.
On the last day of the third on-site training session, 7 students received their « Instructor in visualisation of maritime data” certificate.
Beyond the knowledge acquired during the levels 1 and 2 and that have been reinforced, the students having obtained the certificate of “Instructor in visualisation “ can:
- Run a class and train a group of adults.
- Deliver training sessions for the levels 1 and 2 to a group of students, and adapt the content to their level.
- Install and administer a file server.
- Write SQL database requests.

